Borrow against the thing you are buying, and let the thing you are buying pay the loan back. That is the whole idea of a leveraged buyout, and the rest of the subject is detail about who lends, how much, and what goes wrong when the borrowed money costs more than the company earns.
How a leveraged buyout works
A buyout fund agrees to buy a company, usually for control. In a typical deal the private equity firm buys majority control of an existing or mature firm1. A fund that does this seeks a controlling equity stake in a mature company, which sets it apart from a venture fund that takes minorities in young ones4. For the wider picture of how funds are built, see how a private equity fund works.
The price is then split between two kinds of money. The buyout is typically financed with anywhere from 60 to 90 percent debt, which is where the name comes from1. The fund’s investors supply the remaining 10 to 40 percent as equity1. If the target is a listed company, the buyer typically pays a premium of 15 to 50 percent over the current share price1.
After closing, the company’s own cash flows service the debt6. Partial debt financing lets the buyer maximise the return on the capital it has invested9. That is the part that makes leverage attractive to a fund, and the part that makes it dangerous, because the debt must be paid whether or not the plan works.
Where the money comes from
Debt in a buyout arrives in layers, each with a different claim on the company. The debt almost always includes a senior secured loan arranged by a bank or an investment bank1. Traditionally the debt in a portfolio company’s capital structure comes from banks and is often redistributed to other banks and institutional debt market participants4. Behind the senior loan sit junior layers that rank lower and cost more.
| Layer | What it is | Source |
|---|---|---|
| Senior secured loans | Leveraged loans are loans with non-investment grade ratings, usually senior and secured | 2 |
| High yield bonds | Debt securities issued by corporations with non-investment grade ratings | 2 |
| Equity | The fund’s own money, which absorbs losses first | 1 |
Lenders have changed over time. In the 1980s and 1990s banks were the primary investors in the senior loans1. In the 1970s and 1980s, private equity-backed companies were among the earliest and most frequent issuers of high yield bonds to fund their takeovers2. Private credit assets under management exceeded US$767 billion in 2018, more than three times the amount in 20082.
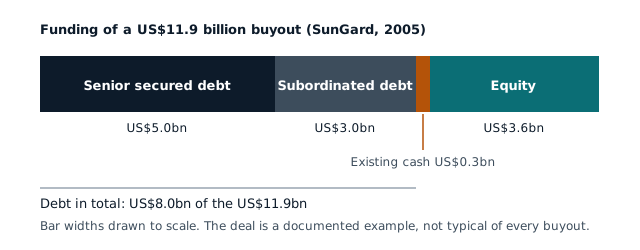
A real deal shows the proportions. The 2005 buyout of SunGard Data Systems was an US$11.9 billion transaction financed with US$8 billion of debt, US$0.3 billion of existing cash and US$3.6 billion of equity1. The debt was US$5 billion of senior secured debt and US$3 billion of subordinated debt1. Seven private equity firms contributed US$3.5 billion of the equity, with management contributing US$0.1 billion1.
A buyout does not usually make the fund liable for the debt. In almost all cases limited liability is preserved at the company level2. That is why a failed buyout costs the fund its equity but not, as a rule, its other investments.
How to build an LBO model: a worked example
Practitioners test a deal with an LBO model, a projection tool that forecasts a company’s financial trajectory, typically over a five-year horizon7. The method has five steps. Project the company’s EBITDA at the time of sale7. Select an exit multiple, based on how similar companies are valued in the current market7. Multiply the projected EBITDA by the exit multiple to find enterprise value7. Subtract any remaining debt from enterprise value to get equity value7. Multiply equity value by the fund’s ownership stake to find its share of the proceeds7.
Worked example (our arithmetic). The company, prices and growth below are invented for illustration and are not a real deal. The five-step method is the one above7. The company earns EBITDA of 20 (units are unspecified). The fund pays 8 times EBITDA, so the price is 160. It borrows 80, which is 4 times EBITDA, and puts in 80 of equity. Over five years the company’s cash flow, after interest, repays 40 of the loan. Interest, fees and tax beyond that are ignored in all cases so the sums stay readable; including them would lower the leveraged return.
| Case | EBITDA at sale | Exit multiple | Enterprise value | Debt left | Equity value | Money multiple | Annual return |
|---|---|---|---|---|---|---|---|
| A. Plan works | 28 | 8 | 224 | 40 | 184 | 2.30 times (our arithmetic7) | 18.1% |
| B. No growth | 20 | 8 | 160 | 40 | 120 | 1.50 times (our arithmetic7) | 8.4% |
| C. Exit multiple falls | 20 | 6 | 120 | 40 | 80 | 1.00 times (our arithmetic7) | 0.0% |
| D. Plan works, no debt | 28 | 8 | 224 | none | 264 | 1.65 times (our arithmetic7) | 10.5% |
Case A returns 184 on 80, a multiple of 2.30 times, or about 18.1% a year over five years (our arithmetic7). Case D buys the same company for 160 of equity and keeps the 40 of cash that would otherwise have repaid the loan, so the equity value is 224 plus 40, and the multiple is 1.65 times (our arithmetic7). The gap between A and D is what leverage adds when things go well. Cases B and C show the other side: with no growth the multiple is 1.50 times, and with a lower exit multiple the fund gets its money back and nothing more.
The return measure is the one named in the model: a multiple of money, and an internal rate of return that annualises it7. The sums here only show direction. They are not a forecast for any company, and a real model carries many more lines.
Why private equity uses debt
Debt buys three things. It can lift equity returns, add a tax shield and align management incentives2. The costs are increased financial risk, including the risk of bankruptcy, and other operating and financial frictions2. Each deserves a sentence of its own.
Pressure. Leverage pressures managers not to waste money, because they must make interest and principal payments1. That is the discipline argument: a company with a loan to service has fewer ways to dissipate cash.
Tax. In the US and many other countries, leverage can also raise firm value through the tax deductibility of interest1. A range of assumptions puts the reduced taxes from the higher interest deduction at anywhere from 4 percent to 40 percent of a firm’s value1. The size is hard to pin down, and the range shows why.
Fragility. On the flip side, if leverage is too high, the inflexibility of required payments raises the chance of costly financial distress1. Interest coverage, the ratio of EBITDA to interest, measures how fragile a buyout is1.
Debt is also not chosen company by company. LBO capital structures are most strongly related to prevailing debt market conditions at the time of the buyout1. When credit is cheap, deals carry more of it.
How buyouts try to create value
The debt is half the story. Private equity firms apply three sets of changes to the companies they buy: financial engineering, governance engineering and operational engineering1. The investment process behind them is covered in the investment approach page.
Management ownership is the first lever. In 1980s public-to-private deals management ownership percentages rose by a factor of four1. In a later sample of 43 US buyouts, the CEO got 5.4% of the equity upside and the management team as a whole got 16%1.
Governance is the second. One-third of chief executives of buyout companies in a UK sample were replaced in the first 100 days, and two-thirds within four years1.
Operations are the third, and the evidence is cautiously positive. In 1980s US public-to-private deals the ratio of operating income to sales rose by 10 to 20 percent, absolutely and relative to industry1. The authors read the evidence as largely consistent with operating and productivity improvements and as largely inconsistent with value destruction or short-termism1. On jobs, employment grows at firms that experience leveraged buyouts, but at a slower rate than at similar firms, with France the exception1.
How risky are leveraged buyouts?
The honest answer is that the average is better than the headlines and the tail is worse. Across 17,171 sponsored buyouts from 1 January 1970 to 30 June 2007, 6% ended in bankruptcy or reorganisation1. Assuming a six-year average holding period, that is an annual default rate of 1.2%, below the 1.6% that Moody’s reported for all US corporate bond issuers from 1980 to 20021. The 1980s were harsher: 23% of the larger public-to-private transactions of that decade defaulted at some point1.
Three features of the loan contract shape the risk. Maintenance covenants are far more restrictive, because they require the borrower to meet financial tests every quarter whether or not it takes an action2. Covenant-lite loans use looser incurrence covenants instead2. And in a Moody’s review quoted in the 2021 paper, one third of the loans examined in 2019 allowed virtually uncapped EBITDA add-backs for restructuring charges, cost savings and other synergies before they had been achieved, which can flatter the headline leverage ratio2.
Conflicts matter too. A firm that runs an equity fund alongside a credit fund can end up investing at different levels of the capital structure of the same company4. That is well aligned while the company performs; the alignment may be undermined when it is in financial distress and the interests of investors in different parts of the structure diverge4. The SEC adds that private equity firms often have interests in conflict with the funds they manage3.
Liquidity is the investor’s own risk: a fund interest is often hard to sell, and several years can pass before any return arrives3.
Boom and bust: the three waves
Buyout activity moves in cycles. Leveraged buyouts first emerged as an important phenomenon in the 1980s1, and firms such as KKR pioneered them from the 1970s6. The first wave ended when the junk bond market crashed after Drexel Burnham Lambert failed1. Public-to-private activity then fell to less than 10 percent of transaction value1.
The second wave built from 2004. From 2005 through June 2007 there were 5,188 recorded buyouts with an estimated enterprise value of over US$1.6 trillion in 2007 dollars1. Funds took in a record amount of capital in 2006 and 20071.
Credit explains much of the pattern. A necessary but not sufficient condition for a boom is for earnings yields to exceed high yield interest rates1. In the first wave debt investors offered too much leverage1. By the later wave, a 2021 sample finds the typical deal shifted between 2007 and 2009 from majority debt to majority equity2. Fundraising has its own cycle: fund returns tend to decline when more capital is committed to the asset class1.
| Measure | Figure | Source |
|---|---|---|
| Mean entry leverage (net debt to EBITDA) | 4.2, with a middle half of 2.8 to 5.4 | 2 |
| Mean entry EBITDA multiple | 10.77, with a middle half of 7.65 to 12.48 | 2 |
| Typical holding period | About 4.6 years, with a middle half of 2.3 to 6.5 years | 2 |
| Share of deals financed with debt | 40% to 60% in the majority of deals | 2 |
The table is a 2021 sample of buyouts from StepStone data and is context, not a rule. Two ideas sit inside it. High debt-to-value deals perform better but carry more risk2; high leverage ratios go with above-average entry multiples and somewhat lower returns2.
Exits and what investors keep
Most buyouts end in a sale. Among exited deals the most common route is a sale to a strategic buyer, at 38% of exits1. A sale to another fund, a secondary buyout, accounts for 24%1, and a public listing for 14%1. The median holding period is around six years1, and only 12% of deals are exited within 24 months1.
The fund’s investors do not keep the whole gain. Fees equal US$19 in present value per US$100 of capital under management for the median fund1. The fund manager earns a share of the profits, carried interest, that almost always equals 20 percent1. Fees and carry explains the arithmetic, and the J-curve shows why returns start negative.
Whether buyouts beat listed shares after fees is contested. A frequently cited US study finds that fund investors earn slightly less than the S&P 500 net of fees, at 93 percent to 97 percent of its outcome, although the data cover roughly half of funds and carry an unknown selection bias1. A fund can also use debt of its own: funds increasingly borrow against limited partner commitments2. Subscription lines of that kind typically have to be repaid in 30 days to one year2, and they do not let a fund invest more than its committed capital2. Fund-level leverage raises the internal rate of return at the expense of a lower multiple of invested capital2.
Leveraged buyouts in Asia
Asia-Pacific buyout investment reached US$138 billion of deal value in 2024, up 8.1% from US$127 billion in 20235. Buyouts passed 50% of deal value while the share of growth deals shrank5. Average deal size rose to US$133 million, up 22% on 20235.
Carve-outs, buying a division from a larger company, were 20% of all buyouts over US$100 million in 2024, up from 11% in 20235. Cheaper credit seems to have drawn more buyouts across most of the region5. Platform investing, where a fund builds a large portfolio company through many low-cost bolt-ons, is spreading among managers5. The exit side is the pressure point: by the end of 2024 the 2011 to 2019 vintages included more than 200 portfolio companies held for more than four years5.
These are regional figures from one law firm’s compilation of AVCJ and Bain data, so treat them as scale and direction. In Hong Kong, a firm with discretionary power to make investment decisions on securities for a fund must hold a Type 9 licence for asset management8; the SFC Licensing Handbook sets out the test and the Type 9 licence page walks through it. The market as a whole is mapped in private equity in Asia.
Read next
Buyouts are one of two main strategies. Buyout versus growth equity sets them side by side, and the strategies hub lists the rest. For the basics of the asset class, start at what is private equity. The SEC’s own investor page on private equity funds and IOSCO’s report on conflicts of interest are the regulator and standards-body starting points. This page is education, not advice, and describes how buyouts work without recommending any fund or deal.
Questions people ask
Are leveraged buyouts risky?
Debt raises the chance of financial distress if payments cannot be met1. In a sample of 17,171 buyouts, 6% ended in bankruptcy or reorganisation1, and 23% of the larger 1980s public-to-private deals defaulted at some point1. The sums also work in reverse: leverage magnifies losses as well as gains6.
Read next
- Buyout vs growth equity: key differencesBuyout, growth equity and venture capital differ in stake, leverage, company stage and exit. A side-by-side reference with the Asia-Pacific deal mix for 2024.
- How a private equity fund works in AsiaA private equity fund is a ten-year limited partnership. Who the partners are, where liability stops, and how Hong Kong, Singapore and Cayman funds differ
- The private equity J-curve: why returns start negativeWhy private equity funds show losses before gains: fees on commitments, slow deployment and late exits, with cash flow data and Asia's exit queue.
Sources
- Leveraged Buyouts and Private Equity (NBER Working Paper 14207, July 2008; Kaplan and Strömberg, data to mid-2007 or 2008) · National Bureau of Economic Research · nber.org · checked 21 October 2026
- Debt and Leverage in Private Equity: A Survey of Existing Results and New Findings (Private Equity Research Consortium and Institute for Private Capital, 4 January 2021) · UNC Kenan-Flagler Institute for Private Capital / PERC · uncipc.org · checked 21 October 2026
- Private Equity Funds · U.S. Securities and Exchange Commission (Investor.gov) · investor.gov · checked 21 October 2026
- Private Equity Conflicts of Interest: Final Report (FR11/10), November 2010 · IOSCO Technical Committee · iosco.org · checked 21 October 2026
- In Private 2025: Top 10 trends for private capital (King & Wood Mallesons, citing AVCJ and Bain & Company Asia-Pacific Private Equity Report 2025, data to end-2024) · King & Wood Mallesons · mallesons.com · checked 21 October 2026
- Private Equity: What You Need to Know · KKR · kkr.com · checked 21 October 2026
- Understanding the Leveraged Buyout Model · Harvard Business School Online · online.hbs.edu · checked 21 October 2026
- Licensing Handbook, October 2024 · Securities and Futures Commission, Hong Kong · sfc.hk · checked 21 October 2026
- Leveraged Buyout (LBO): Definition and How it works · Societe Generale Wholesale Banking (glossary) · wholesale.banking.societegenerale.com · checked 21 October 2026
Published . Education only, not an offer or advice (terms). Rules, fees and market figures change, so each source shows the day it was read. How we check facts · Report an error.