Jump to a section
Picture an investor opening the first statement from a fund it committed to a year earlier. The fund has called some of the money, paid its fees and bought a company or two, and the statement shows a loss. Nothing has gone wrong. That statement is the first point on the J.
The J is not a forecast of failure. It is what a fund's accounts look like while the work is still being done.
The shape, in one sentence
The term “J-curve” refers to the typical pattern of returns for private equity investments, named because the graph over the life of the investment resembles the letter J1. It is a plot of performance against time that dips to negative values first and then recovers to increasingly positive ones2. The same shape shows up whether the line plots cash flows, IRRs or TVPI, the ratio of total value to paid-in capital, though its depth and width vary2. In the usual illustration, net cash outlays in the early years are outstripped by cash inflows in the later years3.
The label is borrowed. Corporate Finance Institute defines a J curve as a chart where the line falls at the beginning and rises gradually to a point higher than the starting point4. Economics uses the same picture for something unrelated, the balance of trade after a currency devaluation4. This page is about funds, and the questions it answers are three: how deep the dip goes, why it happens, and what investors and managers do about it. The fundamentals section holds the pages on the machinery behind it.
What the cash does, year by year
The cleanest evidence is not a marketing chart but the cash flows of real funds. A January 2003 working paper from two NYU Stern finance professors, published through the National Bureau of Economic Research, documents the draw down and capital return schedules of private equity funds5. Its dataset ran from 1981 to 2001 and was three-quarters buyout funds, where the universe of funds was three-quarters venture5. The sample is old and mostly buyout, and it still shows the shape in real cash flows.
Two facts frame it. Fund managers typically only draw down the limited partners’ commitment when they are ready to invest in a portfolio company5. And the cash outflows in the study are the investment draw downs plus the annual management fees5. So a fund does not take the money on day one, and what it does take pays for both companies and fees.
The average fund drew down 16.28, 20.35 and 20.15 percent of committed capital in its first three years, which left it 56.8 percent invested by the end of year 35. The draw down rate then slows, and it takes another three years to hit a 90 percent rate5. By year 10 the average fund is 93.6 percent invested5. On the way out, distributions are rare in the early years: by the end of year 3 only 16.6 percent of invested capital and 12.9 percent of committed capital had been distributed5.
By the end of year 3 the average fund had called 56.8% of its commitments and handed back 12.9%.5
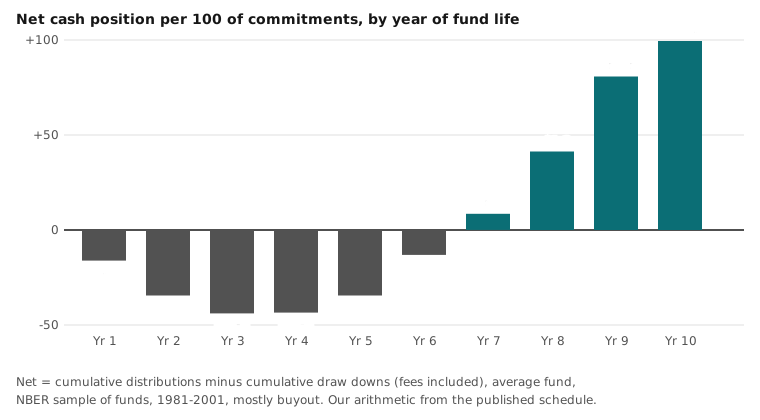
The table puts the study’s schedule in order, and the last column is our own subtraction.
| Year of fund life | Called to date, % of commitments | Distributed to date, % of commitments | Net cash per 100 committed |
|---|---|---|---|
| 1 | 16.285 | 0.145 | -16.1 (our arithmetic) |
| 2 | 36.625 | 2.105 | -34.5 (our arithmetic) |
| 3 | 56.775 | 12.925 | -43.9 (our arithmetic) |
| 4 | 72.645 | 29.135 | -43.5 (our arithmetic) |
| 5 | 83.775 | 49.255 | -34.5 (our arithmetic) |
| 6 | 89.995 | 76.885 | -13.1 (our arithmetic) |
| 7 | 92.345 | 100.865 | +8.5 (our arithmetic) |
| 8 | 93.295 | 134.585 | +41.3 (our arithmetic) |
| 9 | 93.795 | 174.565 | +80.8 (our arithmetic) |
| 10 | 93.625 | 193.175 | +99.6 (our arithmetic) |
Read down the last column and the J draws itself. The cumulative position is deepest, about 44 per 100 committed (our arithmetic), in years 3 and 4, and the average fund crosses zero in year 7. It takes a little under seven years for total invested capital to be returned in the average fund, and around seven years for committed capital5. Much of the capital gain is generated from year 7 onwards5. By year 10 the average fund has distributed 2.07 times its invested capital and 1.93 times its committed capital5, and there is still considerable payoff after 10 years of operation5.
Why the line dips
Four mechanisms hold the early line down, and none of them needs a bad investment.
Fees are charged on the commitment, not on the cash called. During the investment period the management fee is generally a percentage of total commitments to the fund, typically 1-2% a year6. Historically the most common method was to assess fees as a constant percentage of committed capital, and the most common initial fee level is 2 percent7. Capital commitments take several years to be called, yet fees are charged on committed capital before returns are realised8. The fee runs from the first year. The gains come later.
Acquisition costs arrive up front. The fund incurs acquisition expenses during the early phase, and the portfolio companies may require additional investment to support growth initiatives, which can further weigh on returns1. Some early negatives may also come from underperforming portfolios that are written off early4.
Valuations lag. Once the fund buys a company, it is valued quarterly, which creates a lag between acquiring the asset and the realisation of an increased valuation2. Deployment itself may take up to several years, during which there are initial fees and expenses that are realised but little or no appreciation in valuations2.
The manager is paid on profit only after the investors are. The majority of firms and their staff accrue performance-related remuneration only on realised profits, and only after fund investors have received a full return on their investment plus a cost-of-money hurdle6. Carried interest, circa 20% of profits above the hurdle, therefore does not show up until companies are sold6.
Worked example (our arithmetic)
Take a fund with commitments of 100 (assumed) and a fee of 2% a year charged on those commitments, the most common initial fee level in the Wharton study7. Assume the portfolio is held at cost, so no company is marked up or down. Use the NBER average schedule for the cash called5. The fee alone then separates what investors have paid in from what is invested.
| Year | Called to date | Fees paid to date at 2 a year | Invested to date | Value at cost per 1 called |
|---|---|---|---|---|
| 1 | 16.285 | 2.007 | 14.28 (our arithmetic) | 0.88 (our arithmetic) |
| 3 | 56.775 | 6.007 | 50.77 (our arithmetic) | 0.89 (our arithmetic) |
| 5 | 83.775 | 10.007 | 73.77 (our arithmetic) | 0.88 (our arithmetic) |
Even with no loss on any company, holdings valued at cost are worth about 0.88 to 0.89 of each unit of paid-in capital in these years (our arithmetic)57. A fund that makes money must climb back through that gap before its total value to paid-in capital exceeds 1. The assumptions are deliberately simple: they ignore fee step-downs after the investment period, fund expenses and any change in portfolio value.
The same story in IRR terms
Investors usually meet the J as an IRR, the discount rate at which the present value of future cash flows of an investment equals its cost11. IRR is typically used to measure private equity fund performance relative to other asset classes and to benchmark it11. In the NBER sample the average IRR started out at –84.1 per cent in year 1 and increased monotonically as more portfolio companies were exited5.
| Years since first closing | Mean IRR, % | Median IRR, % |
|---|---|---|
| 1 | -84.095 | -97.775 |
| 3 | -64.915 | -86.415 |
| 5 | -42.245 | -48.085 |
| 7 | -9.185 | -11.815 |
| 8 | 2.635 | 1.535 |
| 10 | 16.545 | 15.105 |
| 10 or more | 21.395 | 18.785 |
It takes almost until year 8 for average and median IRRs to turn positive, and value-weighted IRRs do not turn positive until year 95. Because the cost of capital is clearly not zero, excess returns over it arrive even later5. Even by year 10 the exit process is not complete: the IRR of cash received up to year 10 is 16.5 percent, and later cash flows eventually lift it to 21.4 percent on average5. That last step is why a single IRR snapshot of an old fund can still move.
Not every fund draws the same J
The depth and width depend on the strategy, the vintage and the market. An infrastructure fund would likely have a flatter shape, with a lower initial dip, while a buyout fund might have a deeper dip and greater acceleration2. In KKR’s framing the trough of the J is the investment period, when limited partners experience negative cash flow while the manager invests their capital, and the stick is the exit phase, when they receive returns as companies exit and the fund distributes money10. A traditional drawdown buyout fund runs approximately 10-12 years in KKR’s account10. The typical close-ended fund has a ten-year life, extendable by up to three 1-year extensions with investor agreement6.
Vintage matters too, and the NBER study caught it. Funds from the 1998-2001 vintages drew down capital more slowly than older funds but returned it more rapidly, presumably because of the favourable exit climate in the late 1990s5. By year four, recently raised non-venture funds had invested 61.72 percent of committed capital, against 72.47 percent for the older funds5. Market conditions can lengthen or shorten a J by shortening strategies to seize quicker opportunities at the start or holding assets longer at the end for more prosperous exits2. A J is an average, and each real fund draws its own.
How investors soften the dip
An investor cannot remove the J from a single new fund, but several tools reshape the line across a portfolio. Several of the sources below are managers or platforms describing their own approaches, so read them as descriptions and not as neutral studies.
Secondaries. Secondaries also typically experience a different cash flow profile, diminishing the J-curve effect of investing in new funds3. They focus on more mature companies further along in their life cycles1. Buying one can avoid the early fee drag1. Purchasing an interest at a discount to net asset value can provide an early mark-to-market gain and a cushion against the typical J-curve impact, although the availability of discounts depends on a variety of factors8. Early secondaries are interests in young funds that have called less than one-third of committed capital3.
Co-investment. Co-investments are direct investments into a portfolio company alongside a general partner8. Because capital goes into a specific investment rather than a blind pool of future opportunities, they typically provide faster market exposure than primaries and can help mitigate the early phase of the J-curve9. They are typically made on a no-fee, no-carry basis8.
Spreading vintages. Diversifying across multiple vintages and asset classes helps investors use distributions from earlier investments to fund the capital calls of other ones2. Laddering funds lets the anticipated distributions from one fund the capital needs of others2. Borrowing to meet capital calls is another option when it is more cost-effective than pulling from other investments2.
Credit lines. Borrowing at fund level reshapes the reported curve too, and the Institutional Limited Partners Association (ILPA) sets limits on the practice. Subscription lines of credit should be used primarily for the benefit of the partnership as a whole and not chiefly to enhance reported IRR in order to accelerate carried interest11. Such lines should be of short duration, for example outstanding for no more than 180 days11. LPs should be given IRR, TVPI and MOIC figures with and without the use of such facilities11, and the best practice is to disclose the net IRR on both a levered and an unlevered basis11. A shallower reported J is not the same as a shallower cash J, and the “with and without” figures let a reader tell them apart.
Where the right-hand side comes from: exits in Asia
The upswing of the J is a sales event. A fund holds each company for a fraction of its own life, generally well below ten years and more often around three to five6. When sales slow, the recovery slows with them. Asia-Pacific shows the pressure clearly in the King & Wood Mallesons paper that compiles AVCJ and Bain data.
LPs and GPs alike rank the exit environment as the biggest impediment to strong returns12. Asia-Pacific exit value dipped 1% compared with the prior year, although manager sentiment on exits improved in 202412. By the end of 2024 the 2011-2019 vintage group included more than 200 portfolio companies held for more than four years12. Secondary exits, a sale to another private equity fund6, accounted for 27% of total exit value in 202412. Minority stake sales were US$71 billion, 15% of the exit total: not a replacement for exits, but a way for GPs to generate cash and keep exposure to still-ripening assets12. With a sluggish outlook for IPO exits, the region’s secondary market is likely to become more active as GPs seek faster distributions and LPs insist on liquidity12.
The contract also leaves room. Most funds can extend by up to three 1-year extensions, and in theory mutual agreement could lead to an almost infinite extension, though that would be significantly detrimental to the manager’s reputation6. An extension buys time for the recovery. It also lengthens the period an investor waits for cash.
Reading a fund report with the J in mind
The curve is a reading aid, not a verdict, and it raises questions that any report should answer. This is education, not advice.
- Which part of the J is this? An early negative return is typical of the structure1. The same number late in a fund’s life carries a different meaning, which is why the age of the fund belongs next to the figure.
- What sits under the value? Holdings are valued quarterly, and the lag between purchase and a higher valuation is part of the shape2.
- Are the returns levered? ILPA asks for IRR with and without credit facilities, and the answer separates fund performance from financing choices11.
- Can the investor wait? Money can stay locked in for several years before any return is realised, because the investment is often illiquid13. Funds typically impose limits on withdrawal13. Investors should be able to wait the requisite time period before realising a return13.
For the mechanics behind the shape, the fund mechanics page walks through commitments, calls and distributions, the fees and carry page shows how the manager’s pay is built, and what private equity is sets the wider frame. The SEC’s investor guidance, the IOSCO report and the ILPA Principles are the three documents to read for yourself.
Nothing here is an offer, a recommendation or advice, and the curves above describe samples and averages, not any particular fund.
Questions people ask
What is a J-curve in private equity?
A chart of a fund's results over time that dips below zero first and then climbs2. The dip reflects fees and costs paid while investments are still being made, and the climb comes as the fund sells companies at a profit1.
If this left you with a question, start with How a private equity fund works in Asia or Private equity fees: management fee and carry.
Sources
- J-Curves: An Introduction · Hamilton Lane · hamiltonlane.com · checked 21 October 2026
- What is J-Curve in Private Equity and Venture Capital? (glossary, last updated 15 September 2026) · Moonfare · moonfare.com · checked 21 October 2026
- Private equity · Wikipedia · en.wikipedia.org · checked 21 October 2026
- J Curve · Corporate Finance Institute · corporatefinanceinstitute.com · checked 21 October 2026
- The Cash Flow, Return and Risk Characteristics of Private Equity (NBER Working Paper 9454, January 2003) · National Bureau of Economic Research (Ljungqvist and Richardson, NYU Stern) · nber.org · checked 21 October 2026
- Private Equity Conflicts of Interest: Final Report (FR11/10), November 2010 · IOSCO Technical Committee · iosco.org · checked 21 October 2026
- The Economics of Private Equity Funds (Metrick and Yasuda, working paper) · Wharton School, Rodney L. White Center · rodneywhitecenter.wharton.upenn.edu · checked 21 October 2026
- The J-curve in private equity, and how to potentially beat it (17 June 2024) · Russell Investments · russellinvestments.com · checked 21 October 2026
- What is Private Equity & How it Works · BlackRock · blackrock.com · checked 21 October 2026
- Private Equity: What You Need to Know · KKR · kkr.com · checked 21 October 2026
- ILPA Principles 3.0 (2019) · Institutional Limited Partners Association · ilpa.org · checked 21 October 2026
- In Private 2025: Top 10 trends for private capital (King & Wood Mallesons, citing AVCJ and Bain & Company Asia-Pacific Private Equity Report 2025, data to end-2024) · King & Wood Mallesons · mallesons.com · checked 21 October 2026
- Private Equity Funds · U.S. Securities and Exchange Commission (Investor.gov) · investor.gov · checked 21 October 2026
Published . Education only, not an offer or advice (terms). Rules, fees and market figures change, so each source shows the day it was read. How we check facts · Report an error.