Jump to a section
- The metrics in one table
- IRR: how fast money grew
- TVPI, DPI and RVPI: the multiples family
- MOIC versus TVPI: a naming problem
- Cross-check against a CFA Institute sample report
- Gross or net, fund or deal
- Subscription lines: how borrowing flatters IRR
- What the standards require reporting
- Valuation sits under TVPI and RVPI
- Which metric answers which question
- Limits of this page
A private equity fund reports its performance in a handful of initials, and the same fund can look good on one and ordinary on another. This page defines each metric, shows how they connect with labelled worked examples, and says where the standard-setters draw the lines. It is part of the fundamentals section.
The metrics in one table
Wellington Management lists IRR, the multiple (called MOIC or TVPI) and DPI as the standard return metrics in private equity6. The GIPS Standards for Firms add two more ratios, RVPI and PIC1. The table lines them up.
| Metric | What it answers | How it is built | Time sensitive? | Counts unrealised value? |
|---|---|---|---|---|
| IRR | How fast did money grow? | The discount rate that makes the net present value of all cash flows equal to zero6 | Yes6 | Yes6 |
| TVPI | How much value in total per unit paid in? | Total value to since-inception paid-in capital, the investment multiple1 | No6 | Yes6 |
| DPI | How much has actually come back? | Since-inception distributions to since-inception paid-in capital, the realisation multiple1 | No6 | No6 |
| RVPI | How much is still held? | Residual value to since-inception paid-in capital, the unrealised multiple1 | No6 | Yes, by definition1 |
| MOIC | How many times the invested cost? | (Realised value plus unrealised value) divided by invested capital6 | No6 | Yes6 |
| PIC | How much of the commitment has been called? | Since-inception paid-in capital to cumulative committed capital1 | No | Not applicable |
The IRR is time sensitive while the multiple and DPI are not, and the IRR and multiple each account for unrealised value while the DPI does not6. Reading all three together gives a fuller indication of performance than any one alone6.
IRR: how fast money grew
IRR is the discount rate that makes the net present value of all cash flows equal to zero6. The calculation accounts not only for the magnitude of the returns but also their timing, so returns in a short period of time have a larger impact on IRR than those over a longer period6. Under the GIPS Standards, a composite report must present the annualised since-inception money-weighted return, the IRR family, through the most recent annual period end1, calculated using daily external cash flows1.
IRR dominates how managers talk about their own work. In a survey of 79 private equity investors8, the firms rely primarily on IRR and multiples to evaluate investments8, rather than present-value techniques8, and typically target an internal rate of return of 22% on their investments on average, with the vast majority of targets between 20 and 25%8. Those are targets that managers say they use, not results that anyone has achieved.
Worked example: same multiple, different IRR
Take two imaginary investments. Each returns twice the money put in. Only the timing differs. All inputs are invented (our numbers).
| Case | Cash out, start | Cash back | When | Multiple | IRR |
|---|---|---|---|---|---|
| Fast exit | 100 (assumed) | 200 (assumed) | End of year 3 (assumed) | 2.0 times, 200 divided by 100 (our arithmetic)6 | 26.0% (our arithmetic)6 |
| Slow exit | 100 (assumed) | 200 (assumed) | End of year 6 (assumed) | 2.0 times, 200 divided by 100 (our arithmetic)6 | 12.2% (our arithmetic)6 |
With a single outflow and a single inflow, the IRR is the multiple raised to one over the number of years, minus one: 2 to the power of one third gives 26.0%, and 2 to the power of one sixth gives 12.2% (our arithmetic). Both cases return 2.0 times the money, and the faster one has about double the IRR (our arithmetic)6. This is why a multiple and an IRR are quoted together. A short, early profit raises IRR sharply, and a long hold lowers it even when the multiple is unchanged.
IRR is also fragile in the early years of a fund. Interim IRRs computed before a fund reaches maturity are not very informative9, and writing up a portfolio investment long before any actual cash distribution to investors flatters the time profile of returns and thus increases the accounting IRR9. The J-curve page shows the pattern across a fund’s life.
TVPI, DPI and RVPI: the multiples family
Each of these three divides by the same denominator, the capital investors have paid in1. They differ in what goes on top. DPI uses distributions, which are cash that has been paid out6. RVPI uses the residual value of what the fund still holds1. TVPI uses total value, so RVPI equals TVPI minus DPI7. The multiples carry no time dimension6.
Two further points matter when reading them.
- Net or gross. TVPI is quoted net of carried interest: net value is gross value minus realised and accrued carried interest7. Fee and carry treatment is covered on the fees and carry page.
- DPI is the cautious one. Realised returns can be spent or reinvested, while unrealised returns are illiquid, so in volatile environments many investors place a premium on DPI6. The higher the RVPI, the more speculative the performance, because much of it is based on unsold companies7.
Worked example: one fund, two dates
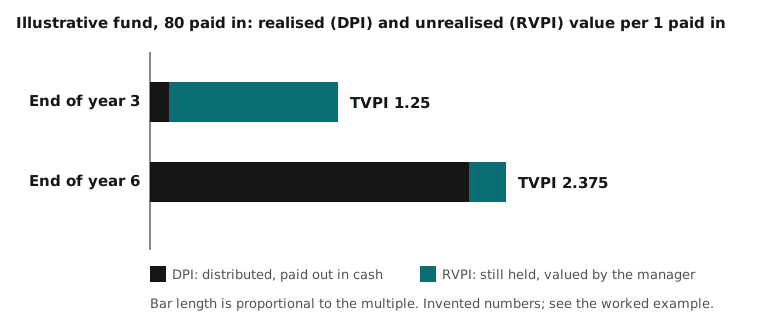
An imaginary fund has commitments of 100. It calls 30 at the end of year 0, 30 at the end of year 1 and 20 at the end of year 2 (assumed), so paid-in capital is 80 and PIC is 0.8 (our arithmetic)1. The table gives two snapshots, with cash flows assumed at each year end.
| Measure | End of year 3 | End of year 6 |
|---|---|---|
| Paid-in capital | 80 (assumed)1 | 80 (assumed)1 |
| Cumulative distributions | 10 (assumed)1 | 170 (assumed, 10 plus 40 plus 60 plus 60)1 |
| Remaining value held | 90 (assumed)1 | 20 (assumed)1 |
| DPI, distributions over paid-in | 0.125 (our arithmetic)1 | 2.125 (our arithmetic)1 |
| RVPI, remaining value over paid-in | 1.125 (our arithmetic)1 | 0.25 (our arithmetic)1 |
| TVPI, DPI plus RVPI | 1.25 (our arithmetic)7 | 2.375 (our arithmetic)7 |
| IRR, remaining value treated as a final cash flow | 10.9% (our arithmetic)6 | 22.8% (our arithmetic)6 |
At the end of year 3 almost all of the 1.25 times is unrealised: DPI is 0.125 and RVPI is 1.125 (our arithmetic)7. By year 6 the position has reversed, with DPI 2.125 and RVPI 0.25 (our arithmetic)7. TVPI roughly doubled, and the IRR with it. The IRR figures come from the spreadsheet IRR function on the annual cash flows (our arithmetic)6. Any year-3 number depends on how the manager valued the 90 still held, which is the subject of the valuation section below.
MOIC versus TVPI: a naming problem
The labels are not used the same way everywhere. Wellington treats the multiple as the same idea under two names, MOIC and TVPI6. The ILPA Performance Template separates them by cash-flow level. Its fund-level table is based on the cash flows between the fund and its investors and displays net IRR and TVPI4. Its gross portfolio-level table is based on cash flows between the fund and its investments and displays gross IRR and MOIC for the realised portfolio, the unrealised portfolio and the total portfolio4. So in ILPA’s usage TVPI is mainly a fund-to-investor, net measure, and MOIC a fund-to-investment, deal-level measure4.
Fund-level net returns cannot be read straight off the deals. Net portfolio-level IRRs may be calculated by applying the ratio or spread of the fund-level net IRR to gross IRR to the portfolio-level gross IRR4, and the portfolio-level net MOIC is a synthetic calculation using the ratio of net to gross TVPI4. When a manager quotes a MOIC, ask whether it is gross, per deal or for the fund, and whether realised and unrealised are separated: ILPA gives no definition of realised or unrealised and asks funds to be clear and consistent and to disclose their methodology4.
Cross-check against a CFA Institute sample report
The GIPS Standards include a sample report for a closed-end composite. Its figures let us test the definitions. The row, in euro millions, reads: paid-in capital 200, cumulative committed capital 300, distributions 20, TVPI 1.2, DPI 0.1, RVPI 1.1, PIC 0.71.
Worked example: checking the sample (our arithmetic)
| Check | Calculation | Result |
|---|---|---|
| DPI | 20 divided by 200 | 0.10, matches 0.1 (our arithmetic)1 |
| PIC | 200 divided by 300 | 0.67, reported as 0.7 (our arithmetic)1 |
| Implied total value | 1.2 times 200 | 240 (our arithmetic)1 |
| Implied residual value | 240 minus 20 distributed | 220, so RVPI is 220 divided by 200, which is 1.1 (our arithmetic)1 |
| TVPI | DPI 0.1 plus RVPI 1.1 | 1.2 (our arithmetic)1 |
The sample is internally consistent: the realisation and unrealised multiples add up to the investment multiple, and PIC is rounded to one decimal1. Note how little of the 1.2 times is cash. Only 20 of 240 of total value has been distributed (our arithmetic)1.
Gross or net, fund or deal
- Gross returns come before fees and carry, and net after them. The GIPS Standards say a firm should present both annualised gross-of-fees and net-of-fees since-inception money-weighted returns1. Net IRR is the annualised return after fees and carried interest, counting both realised and unrealised companies7.
- Fund-level measures use the cash flows between the fund and its investors; portfolio-level measures use the cash flows between the fund and its investments4.
- Benchmarks. A public market equivalent assumes buying and selling an index on the same dates and amounts as the fund’s limited partner capital calls and distributions6, so private and public returns can be compared on the same timing.
Subscription lines: how borrowing flatters IRR
A subscription line of credit is a loan against investors’ unfunded commitments that lets a fund make an investment now and call investors’ money later. Because IRR counts when cash left the investor’s account, delaying the call raises IRR without changing the multiple.
Worked example: delaying the call (simplified, our arithmetic)
A fund invests 100 and sells for 150 at the end of year 4 (assumed)6. Interest on the credit line and fees are ignored (assumed).
| Case | Investors pay in | Investors receive | Multiple | IRR |
|---|---|---|---|---|
| Call at purchase | 100 at end of year 0 (assumed) | 150 at end of year 4 (assumed) | 1.5 times (our arithmetic)6 | 10.7% (our arithmetic)6 |
| Call one year later, line bridges the gap | 100 at end of year 1 (assumed) | 150 at end of year 4 (assumed) | 1.5 times (our arithmetic)6 | 14.5% (our arithmetic)6 |
The multiple is identical, and the IRR is nearly four points higher only because investors’ money was outstanding for three years and not four (our arithmetic)6. In a real fund the line costs interest, which lowers the net figures, and the line is repaid with a later capital call.
Both standard-setters respond by asking for two numbers. Under GIPS, if a subscription line of credit is used, the firm must present the since-inception money-weighted return both with and without the line1. The exception: it need not show the without-line figure where the line was repaid within 120 days using committed capital drawn down through a capital call and was not used to fund distributions2. ILPA’s fund-level table shows net IRR and TVPI both with and without the impact of fund-level subscription facilities4.
What the standards require reporting
| Item | GIPS Standards, 2020 | ILPA Performance Template |
|---|---|---|
| IRR basis | Annualised since-inception money-weighted return1 | Net IRR at fund level, gross IRR at portfolio level4 |
| Multiples | TVPI, DPI, PIC and RVPI1 | Net TVPI at fund level, gross MOIC at portfolio level4 |
| Capital figures | Since-inception paid-in capital, distributions and cumulative committed capital1 | Based on cash flows between fund and investors4 |
| Subscription line | Show returns with and without the line, subject to the 120-day exception12 | Net IRR and TVPI with and without the line4 |
| Status | Requirements for firms that claim compliance1 | Standardises return calculation methodologies3; to be used for funds commencing operations on or after 1 January 20263 |
ILPA publishes two versions of the Performance Template, and both display the same fund- and portfolio-level performance metrics and cash flow data3. The table sets out what each document asks for, not what any fund does.
Valuation sits under TVPI and RVPI
DPI is cash. TVPI and RVPI are not: they include residual value, which is the manager’s estimate of what unsold companies are worth1. For the same reason accounting valuations are not bankable and may never be followed by commensurate cash distributions9. Two safeguards are worth knowing.
- IPEV Valuation Guidelines. The IPEV Board’s mission is to provide high quality, uniform, globally acceptable, best practice guidance for private capital valuation purposes5. The Board published its latest Valuation Guidelines on 14 December 20225.
- GIPS disclosure. A firm must present the percentage of the total fair value of composite assets valued using subjective, unobservable inputs, if such investments represent a material amount of composite assets1.
Which metric answers which question
| Question | Best-fit metric | Why |
|---|---|---|
| How much cash have I received? | DPI | Counts distributions only6 |
| What is my whole position worth, in multiples of what I paid in? | TVPI | Adds residual value to distributions7 |
| How much of that position rests on the manager’s valuations? | RVPI | Residual value to paid-in1 |
| How fast has money compounded? | IRR | Accounts for timing6 |
| How did one deal do against its cost? | Gross MOIC | Portfolio-level, fund-to-investment cash flows4 |
| How far has the commitment been called? | PIC | Paid-in to committed1 |
| Would the same cash flows have done better in an index? | Public market equivalent | Same dates and amounts in an index6 |
Limits of this page
The worked examples use invented figures and annual cash flows to show how the arithmetic works. They are not forecasts of any fund and are not a benchmark. Definitions follow the CFA Institute and ILPA documents cited, and a manager’s own report may differ in detail, so read the notes to any performance table. Education only: nothing here is an offer or advice, and no fund or manager is recommended.
RelatedThe private equity J-curve: why returns start negativePrivate equity fees: management fee and carryHow a private equity fund works in Asia
Sources
- Global Investment Performance Standards (GIPS) for Firms, 2020 edition · CFA Institute (GIPS Standards) · gipsstandards.org · checked 21 October 2026
- Exception to GIPS Standards Provisions 1.A.8 and 1.A.9 for the Purpose of Complying with FINRA's Regulatory Notice 20-21 · CFA Institute (GIPS Standards) · gipsstandards.org · checked 21 October 2026
- ILPA Performance Template · Institutional Limited Partners Association · ilpa.org · checked 21 October 2026
- Performance Template Guidance: Gross Up Methodology (January 2025) · Institutional Limited Partners Association · ilpa.org · checked 21 October 2026
- IPEV Board publishes updated International Private Equity and Venture Capital Valuation Guidelines (14 December 2022) · International Private Equity Valuation (IPEV) Board · privateequityvaluation.com · checked 21 October 2026
- Understanding private equity performance · Wellington Management · wellington.com · checked 21 October 2026
- Private Equity Fund Performance Metrics: TVPI vs. MOIC vs. DPI and Gross vs. Net IRR · Breaking Into Wall Street · breakingintowallstreet.com · checked 21 October 2026
- What Do Private Equity Firms Say They Do? (NBER Working Paper 21133, April 2015; survey of 79 firms) · National Bureau of Economic Research · nber.org · checked 21 October 2026
- The Cash Flow, Return and Risk Characteristics of Private Equity (NBER Working Paper 9454, January 2003) · National Bureau of Economic Research (Ljungqvist and Richardson, NYU Stern) · nber.org · checked 21 October 2026
Published . Education only, not an offer or advice (terms). Rules, fees and market figures change, so each source shows the day it was read. How we check facts · Report an error.